Running an independent mobile tool route requires consistent sales, strong customer relationships, and careful management of operating costs. Traditional merchant processing fees can quietly reduce the money available for inventory, fuel, and other business needs.
During the audited 12-month period, this dealer processed $248,462.10 in gross sales across 3,408 transactions, with an average transaction value of $72.91.
At a traditional processing benchmark of 3%, that sales volume represents $7,453.86 in potential processing costs.
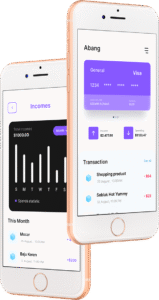
To protect the route’s margins, the dealer transitioned to ToolTruckPay using the iPOS Go mobile app.
The payment setup uses dual pricing to handle the applicable processing cost at checkout. Customers who prefer not to pay the card offset can choose alternative payment methods, including cash or ACH.
The mobile-first approach gives an independent dealer a way to accept payments on the route while keeping the payment process practical for everyday transactions.
Independent mobile tool dealers serve customers in different workplaces and across busy daily schedules. Offering a clear payment process and practical payment choices can help make routine transactions easier to manage.
According to this case study, the dealer used ToolTruckPay’s iPOS Go mobile app with dual pricing. Customers who preferred not to pay the card offset could choose cash or ACH instead.
Based on the dealer’s audited sales volume, potential processing costs were calculated using three traditional processing-rate benchmarks.


For an independent owner-operator, working capital matters. Money spent on processing fees is money that may otherwise support inventory, truck operations, and everyday business needs.
This case study shows how changing the payment-processing structure can affect the financial picture. At a 3% benchmark, processing fees on $248,462.10 in sales would amount to $7,453.86.
The source reports that the dealer paid $0 in merchant processing fees under the described setup during the audited period.

The dealer processed $248,462.10 in gross sales across 3,408 transactions during the 12-month period from October 1, 2025, to September 30, 2026.
At a 3.0% traditional processing benchmark, the calculated potential cash flow was $7,453.86.
The reported average ticket size was $72.91.
The case study describes ToolTruckPay using the iPOS Go mobile app with dual pricing.
Yes. The audit lists four refunds totaling $226.60 and one chargeback of $41.20.
If you operate an independent mobile tool route, find out how traditional payment processing costs could affect your working capital.
Tool Truck Pay was created with one goal: to stop tool truck businesses from losing profits to processing fees.